DNA Break Quant is a fluorescent image‑analysis module designed to detect and quantify double‑strand DNA breaks (DSBs). These breaks can arise from exogenous insults (e.g., radiation, chemical agents) as well as endogenous mechanisms, including DNA replication and repair processes. The workflow operates on γH2AX‑immunostained specimens, in which histone H2AX becomes phosphorylated (γH2AX) at sites of damage, forming γH2AX foci. These foci are visualized by immunofluorescence using anti‑γH2AX antibodies, enabling precise quantitative analysis.
DNA Break Quant
DNA Break Quant
DNA Break Quant is a fluorescent image‑analysis module designed to detect and quantify double‑strand DNA breaks (DSBs). These breaks can arise from exogenous insults (e.g., radiation, chemical agents) as well as endogenous mechanisms, including DNA replication and repair processes. The workflow operates on γH2AX‑immunostained specimens, in which histone H2AX becomes phosphorylated (γH2AX) at sites of damage, forming γH2AX foci. These foci are visualized by immunofluorescence using anti‑γH2AX antibodies, enabling precise quantitative analysis.
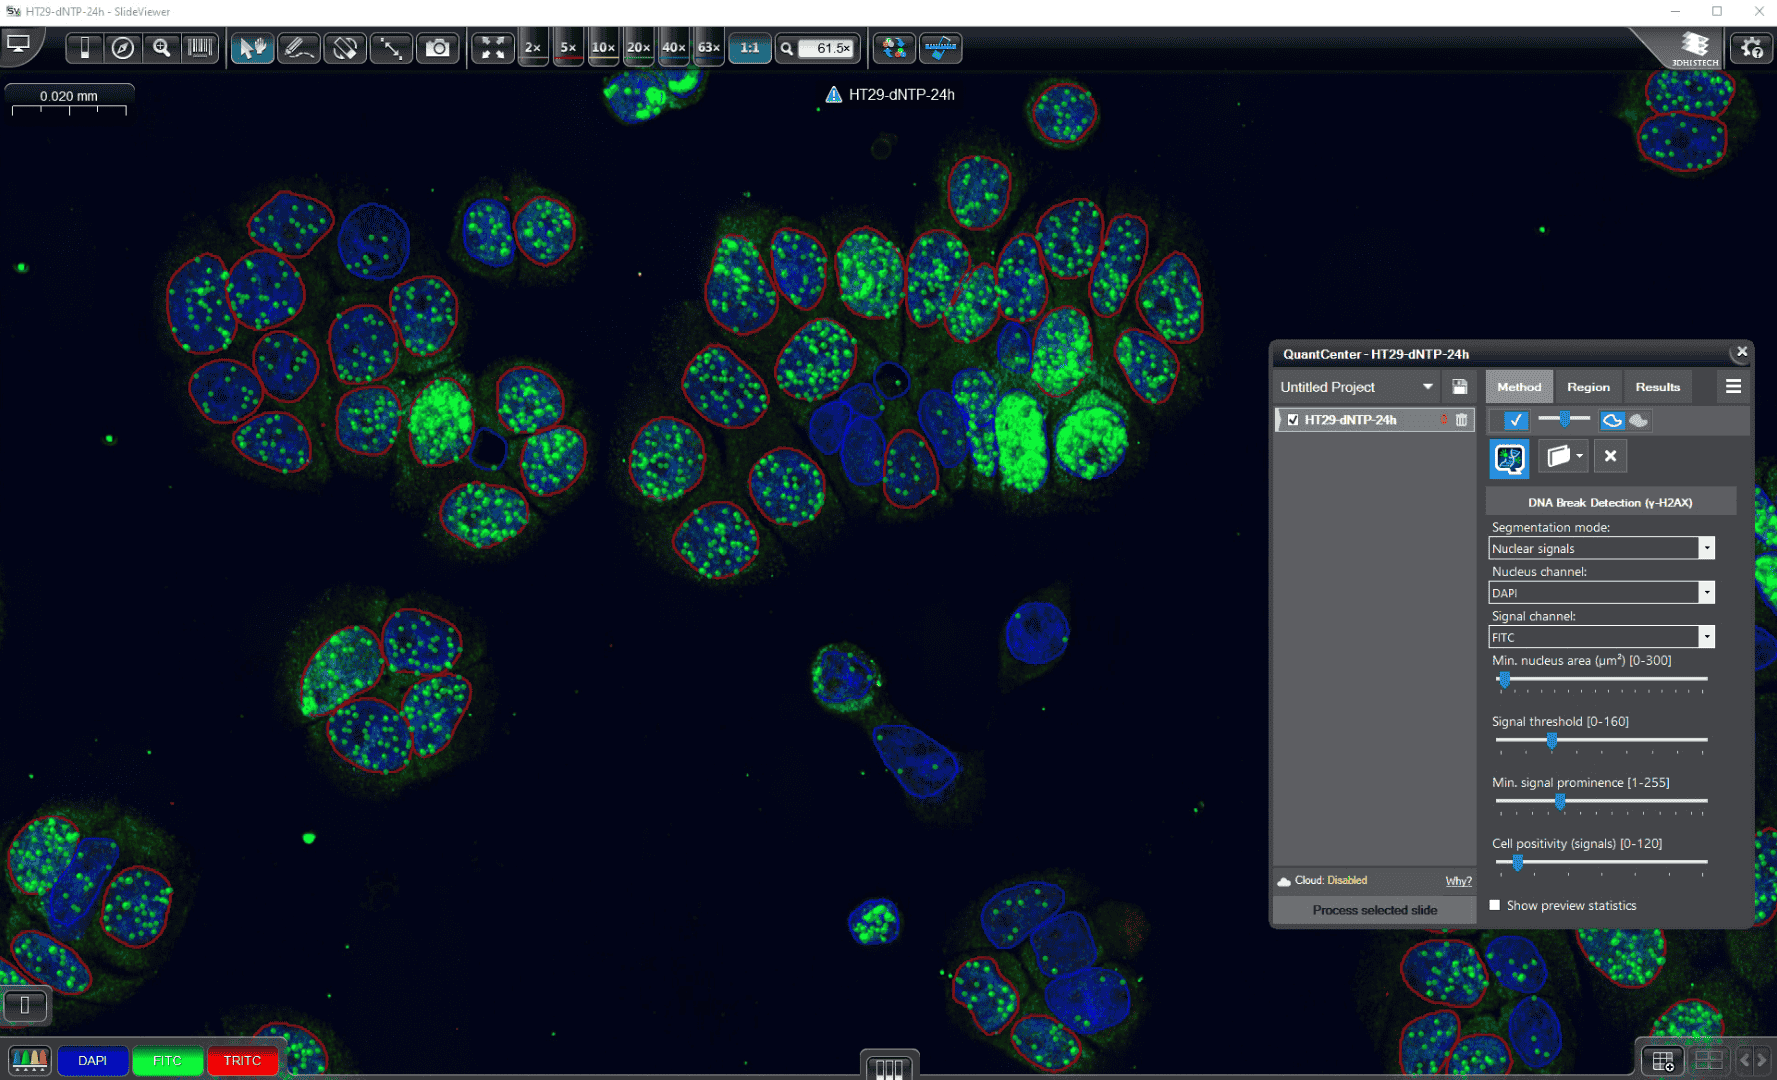
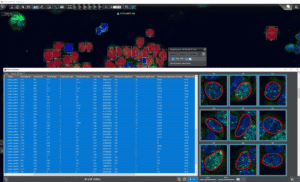
DNA Break Quant Module in QuantCenter
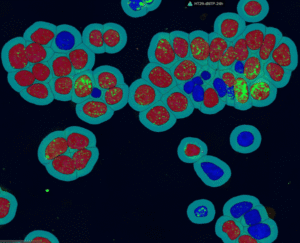
Detection method
The module evaluates signal intensity and spatial context to detect signal foci, cell nuclei, and delineate perinuclear/cytoplasmic proximity zones, and then reports cell‑level positivity along with detailed object metrics and summary statistics.
Segmentation modes
DNA Break Quant offers different segmentation modes, which allow us to examine signals, nuclear regions, and cytoplasmic circulating spots together.
|
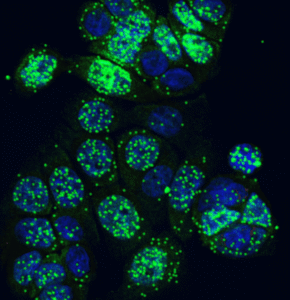
Signals only |
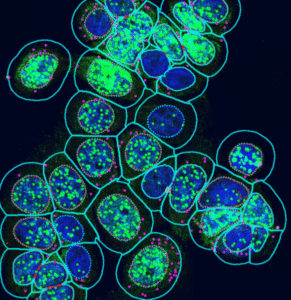
Nuclear signals | Nuclear & extranuclear signals |
|
detects local intensity peaks on the γH2AX signal channel |
binds signals to DAPI‑detected nuclei for per‑nucleus evaluation |
extends nuclear analysis with an approximated cytoplasmic margin to capture perinuclear signals |
 |
 |
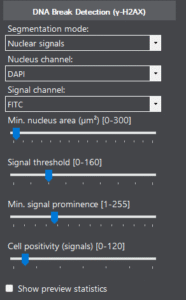
Key parameters
By fine-tuning the segmentation, channel, and evaluation parameters, the operation of the algorithm can be adapted to the samples.
|
 |
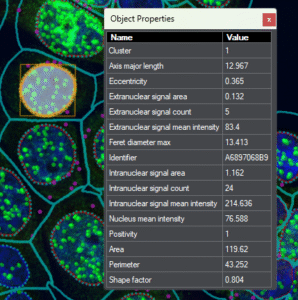
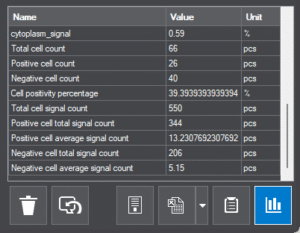
Results and Statistics
DNA Break Quant can visualize the analysis results at different levels, providing all the information for research, from intra-cellular metrics to detailed statistics between samples.
|
Cell-level metrics |
Slide-level statistics |
|
positivity, signal statistics, morphological parameters, etc. |
counts, percentages, positive-negative ratio, etc. |
 |
 |
|
Project-level analysis with SlideManager |
|
|
comparative analysis and correlation study across multiple samples using |
|
 |
|
|
Data visualization |
|
|
deep inspection and export through the Data Visualization Tool (DVT) |
|
 |
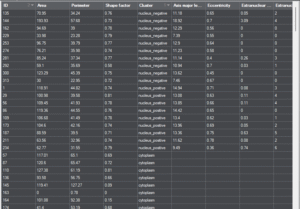 |
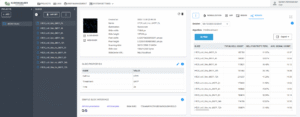
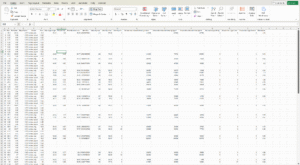
Data mining and export
For further examination of nuclei and signals, Detailed Export Functions provide researchers with extensive data for statistical evaluation and data mining. With the enhanced ScriptQuant functionality, detailed object-level data (e.g., cell nuclei) can be assigned within custom algorithms, visualized, and exported for further processing. The QuantServer interface in SlideManager supports comprehensive export options, allowing all measurement data across slides to be saved in XLS, CSV, or JSON formats. Exported data includes not only quantified values but also geometric attributes such as centroids, bounding boxes, and polygons. This information is also accessible via the Data Visualization Tool, facilitating advanced spatial analysis and deeper insights.
 |
 |